|
|
|
| P R I N T E R - F R I E N D L Y F O R M A T | Return to Article |
D-Lib Magazine
November/December 2014
Volume 20, Number 11/12
AMI-diagram: Mining Facts from Images
Peter Murray-Rust and Richard Smith-Unna
University of Cambridge, UK
{pm286, rds45}@cam.ac.uk
Ross Mounce, University of Bath, UK
ross.mounce@gmail.com
doi:10.1045/november14-murray-rust
Abstract
AMI-Diagram is a tool for mining facts from diagrams, and converting the graphics primitives into XML. Targets include X-Y plots, barcharts, chemical structure diagrams and phylogenetic trees. Part of the ContentMine framework for automatically extracting science from the published literature, AMI can ingest born-digital diagrams either as latent vectors, pixel diagrams or scanned documents. For high-quality/resolution diagrams the process is automatic; command line parameters can be used for noisy or complex diagrams. This article provides on overview of the tool which is currently being deployed to alpha-testers, especially in chemistry and phylogenetics.
Keywords: AMI-Diagram, Converting Graphics Primatives, XML
1. Introduction
There are at least 10 million diagrams published in the scientific literature each year and many of them represent factual information. AMI-Diagram is a flexible tool which can mine facts from diagrams and convert the graphics primitives into XML. The targets include X-Y plots, barcharts, chemical structure diagrams and phylogenetic trees. AMI can ingest born-digital diagrams either as latent vectors (converted from Postscript), pixel diagrams (PNGs and JPEGs) or scanned documents. For high-quality/resolution diagrams the process is automatic; command line parameters can be used for noisy or complex diagrams. AMI is part of the ContentMine framework for automatically extracting science from the published literature.
2. Background
Over 1 million scientific articles are published yearly and a similar amount of theses and grey literature [1]. Many contain diagrams, such as graphs or domain-specific objects, representing factual information and often this is the primary way of communicating the information contained (e.g. molecular structure diagrams). Almost all diagrams are now born digital (i.e. the output is written directly from a program to file). The originating programs include generic plotting packages (GNUPlot, R, Excel), specialist editors such as JChempaint or Chemdraw for molecules, or are generated directly from instruments (e.g. spectra). The plots are usually high resolution, either scalable vectors + text (such as SVG or Postscript derivatives) or large pixel maps, often between 1 million and 20 million pixels.
Since most scientific data is never published (estimates are often > 80% loss; [2]), extraction of data from images can be a vital source of semantic data. Traditional, labour intensive approaches include pencil and ruler, or cutting out peaks and weighing the paper and these are still, unfortunately, used today. Authors are reluctant to save data publicly; the Treebase database of phylogenetic trees only contains 4% of published trees.
3. Overview
Converting a semantic object to vector or pixel graphics loses most of the information. However in some domains it is possible to combine computer vision techniques with machine-learning or rules/heuristics to recover the likely generating object. Moreover, ambiguity can often be resolved by lookup against public semantic data (e.g. dbpedia.org) or recomputing the object. We have therefore developed image and vector processing technology which can reconstruct semantic data from a wide range of diagrams. Users may start with PDF documents, PNG or JPEG diagrams, or other sources of vectors (Word or Powerpoint EWF, PostScript, etc.). AMI is a work-in-progress being deployed to alpha-testers especially in chemistry and phylogenetics.
The overall process is:
- Dissect and restructure PDFs and extract images.
- Transform raw images into SVG.
- Associate SVG with extracted captions to add semantics and classification.
- From the SVG primitives, build domain-independent mid-level graphics objects (boxes, circles, grids, annotations, symbols, etc.)
- Use domain-specific heuristics from the classification to create high-level semantic objects (x-y plots, molecular structures, phylogenetic trees, maps, etc.)
There is often an advantage in knowing the style of a journal or generating program. Collaboration is very useful here and the AMI framework is developed so that users can add in plugins (AMI uses the Visitor pattern). A Visitor can be tailored to a specific journal or domain of science.
4. Interpreting PDFs
PDFs are made up of three streams: characters with code points or their glyphs; paths (lines and curves); and pixel images.
We use PDFBox from Apache which provides these, but most STM publishers do not use Unicode fonts, and it is formally impossible to identify many character. We use a per-journal lookup which is constructed by expert classification. There is often some difficulty in identifying the pixel images and they may be layered with character codes or paths. We translate characters and paths to SVG which is an excellent intermediate format. We generally keep the images as PNGs as the SVG representation is verbose.
5. Interpreting pixel maps
We have tried many methods including Hough line transforms, erosion (e.g BoofCV), and histogram equalisation. The following are the problems and approaches that we have found most appropriate for modern scientific articles. We warn that articles before ca. 2000 may have poor typography with less systematic presentation, and this makes it harder to create simple heuristics.
- Colours. Binary (black and white only) are simplest; gradients and dotted regions can cause problems. AMI separates colours into complementary pixel maps and can process each separately. Recombination is at the domain level (e.g. differently coloured subtrees).
- Noise (common in scanned documents), grayscales and antialiasing (very common) mean that background / threshold levels are sometimes critical. AMI can adjust these either from human control or a simple adaptive optimisation.
- Bleeding and cavitation. Graphics primitives which are close often "bleed" into a single object; faint primitives may have holes. Where glyphs interbleed we separate them heuristically (by comparion with target glyphs)
- Thinning. AMI reduces lines and strokes to single pixel width using the Zhang-Suen approach and then tidies some redundant pixels.
- Character recognition (OCR). Traditional OCR methods (machine learning, correlations, moments and Mahalanobis) don't work well with scientific characters which are often rotated, isolated, have variable fonts, italic and/or bold and cover a wide range of Unicode (maths, Greek, symbols). We have developed a topological approach which is robust to distortion and scaling and can be combined with classical methods (bitwise correlation).
- Separation of objects. We identify objects by floodfill or by expanding borders. Overlap of different colours is often tractable especially where these are primitives (lines, circles); we can sometimes resolve overlapping objects by creating a dictionary of primitives (e.g. symbols).
- Segmentation. PDFs and pixels do not support higher level primitives and AMI uses Douglas-Peuckert segmentation to approximate curved strokes, where possible trying to fit them to circles.
6. Reconstructing objects
Many segmented objects are suitable for domain-specific interpretation. For example:
- Chemical structures are lines and characters, with occasional circles; we often approach 100% recall/ precision for vector or good pixel diagrams. We have successfully converted thousands of molecules, with annotations, and also chemical reactions into Chemical Markup Language (e.g. Figure A).
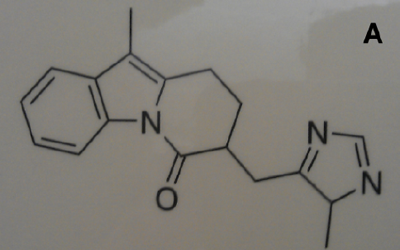
Figure A: A photograph of a chemical molecule on a poster taken with a mobile phone camera, showing varying backgrounds, line broadening and skewing. In spite of this it is automatically and accurately converted to a semantic molecule with formula C18 H18 N3 O in under a second.
- Phylogenetic trees are often tractable, consisting of a single connected trees with labels close to the tip. We can process both rooted (orthogonal and circular, e.g. Figure B) and unrooted trees. For simple diagrams precision is often 100%.
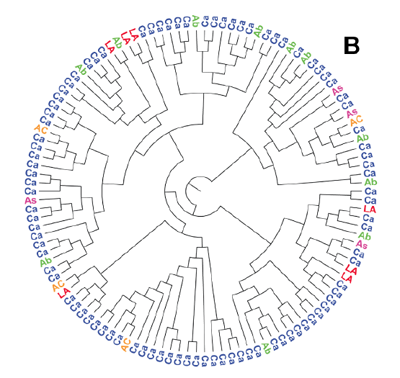
Figure B: This circular tree is separated from its characters and correctly converted to the semantic Newick representation (image from http://doi.org/10.1371/journal.pone.0036933, figure 1).
- X-Y plots are often very tractable (e.g. Figure C), again with high precision; they contain: X- and/or Y- axes each consisting of lines with tick marks, scales, quantities and units; symbols or points, perhaps with error bars and legends for each type; and an overall title.
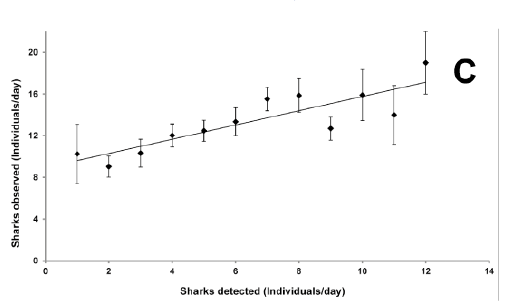
Figure C: This X-Y plot is correctly decomposed into X and Y coordinates of data points and size of the corresponding error bars (image from http://doi.org/10.1371/journal.pone.0095565, figure 2). It is possible to create a CSV file directly from this.
7. Current status
AMI is open source under the Apache 2 license and written in pure Java. It can be deployed as a command-line option including recursion over directories and ingestion of web streams. It ingests PDF, SVG, XML, HTML and image formats and usually takes <1 second per image (some documents include tens of such). It has a plugin architecture using the Visitor pattern so that domain experts can create their own image analysers without having to also write the more basic tools described here. We are actively seeking collaborators.
Acknowledgements
Peter Murray-Rust thanks The Shuttleworth Foundation for a Fellowship and Grant and Ross Mounce thanks BBSRC for support for the PLUTo project
References
[1] Chalmers, I. and Glasziou, P. 2009. Avoidable waste in the production and reporting of research evidence. The Lancet. 374, 9683 (Jul. 2009), 86—89.
[2] Glasziou, P. 2014. The role of open access in reducing waste in medical research. PLoS Med. 11, 5 (May 2014), e1001651.
About the Authors
 |
Peter Murray-Rust is Reader in Molecular Informatics at the University of Cambridge, and Senior Research Fellow of Churchill College, Cambridge. He was educated at Bootham School and Balliol College, Oxford and obtained a Doctor of Philosophy. His research interests have involved the automated analysis of data in scientific publications, creation of virtual communities and the Semantic Web. In 2002, Dr. Murray-Rust and his colleagues proposed an electronic repository for unpublished chemical data called the World Wide Molecular Matrix (WWMM). In 2014 he was awarded a Fellowship by the Shuttleworth Foundation to develop the automated mining of science from the literature. In addition to his work in chemistry, Murray-Rust is also known for his support of open access and open data. |
|
Richard Smith-Unna is a PhD student (Plant Sciences) at University of Cambridge and co-founder of Solvers.io. |
 |
Ross Mounce Ross Mounce is a postdoctoral researcher at the University of Bath. His research is on phylogenetic tree data and associated metadata extraction from the literature. He is council member of the Systematics Association, subject editor for Biodiversity Data Journal (Pensoft), and organising committee member of the OpenCon 2014 meeting. |
|
|
|
| P R I N T E R - F R I E N D L Y F O R M A T | Return to Article |